You might have already read our blog explaining what a Campaign Sketch is and now you want to understand what you can see in the results. We’ll cover that here.
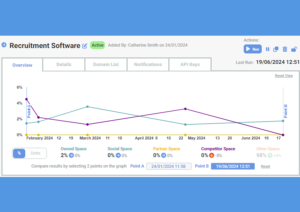
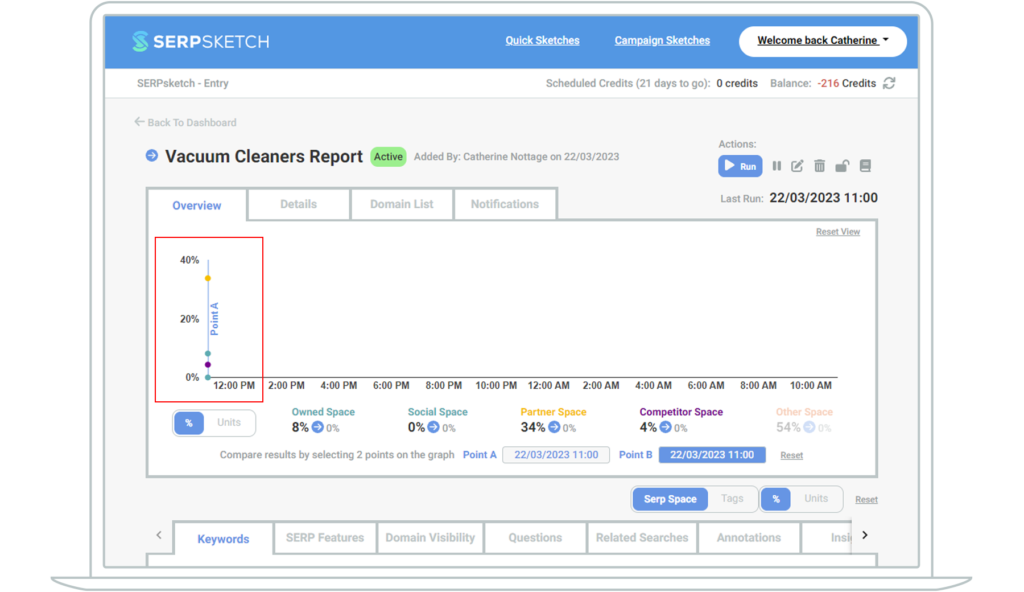
Once your sketch has run the first time, you’ll see a single moment in time view of your sketch. As it runs more often, you’ll start to track changes over time.
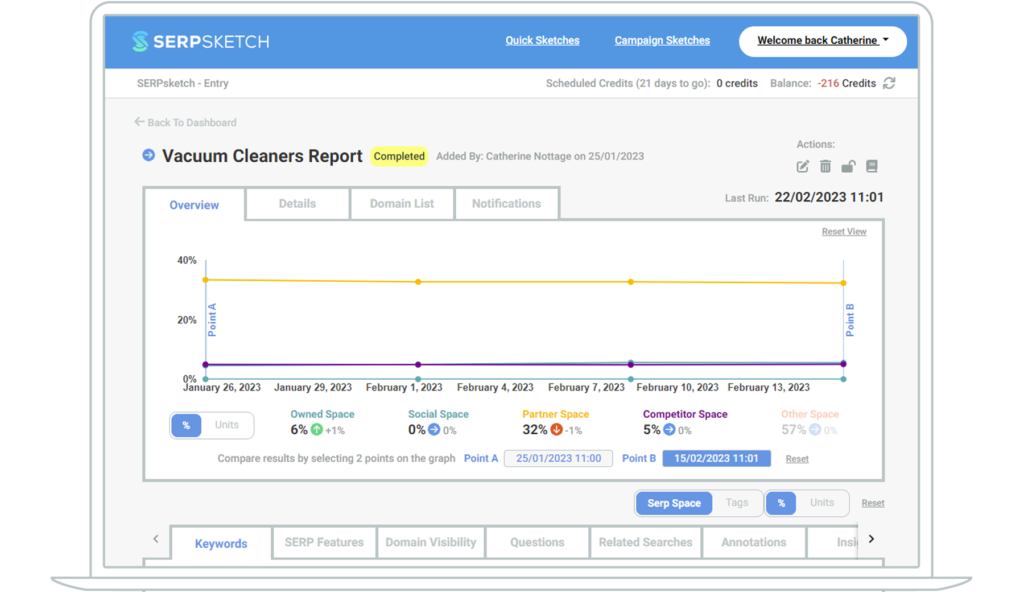
Overview tab
Details tab
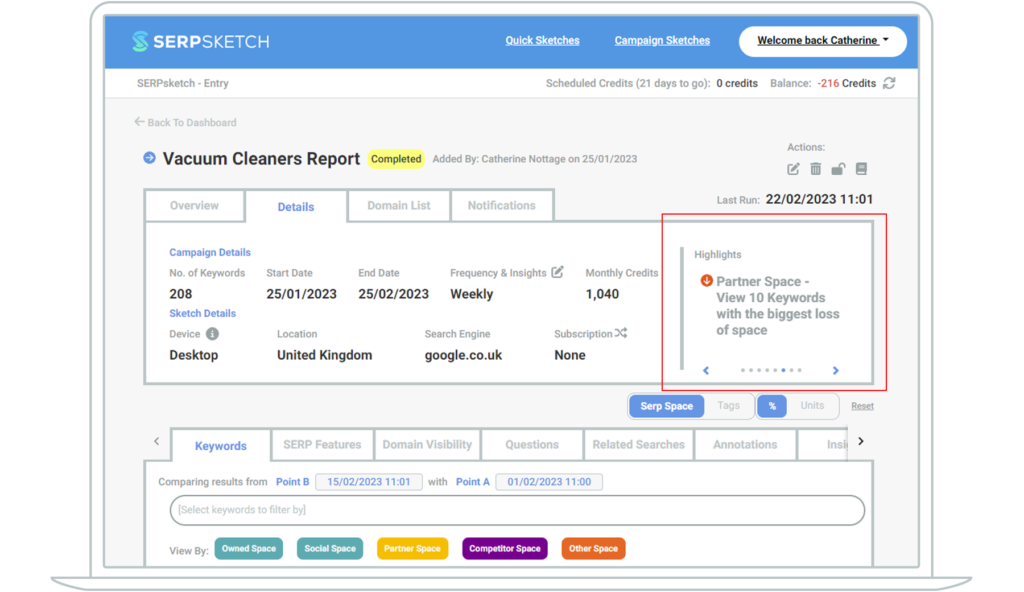
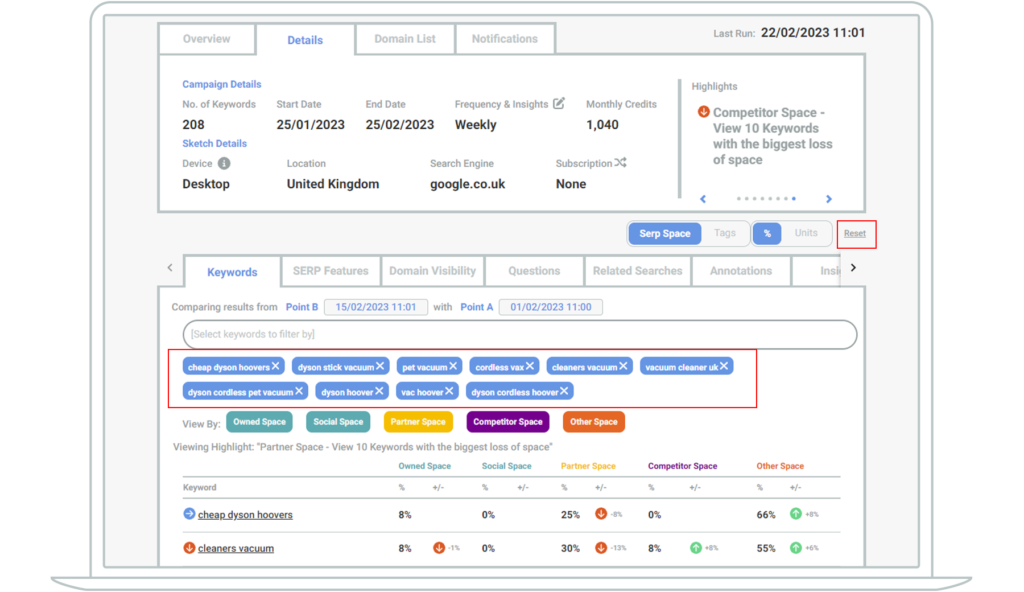
You can click on the highlight and in the keywords section below it will give you the keywords that relate to that highlight e.g. The 10 keywords with the biggest loss of space.
To remove those added filters, you can click the Reset link.
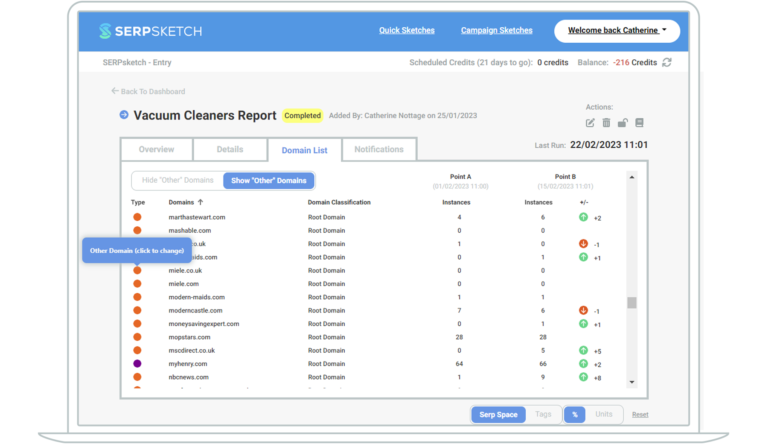
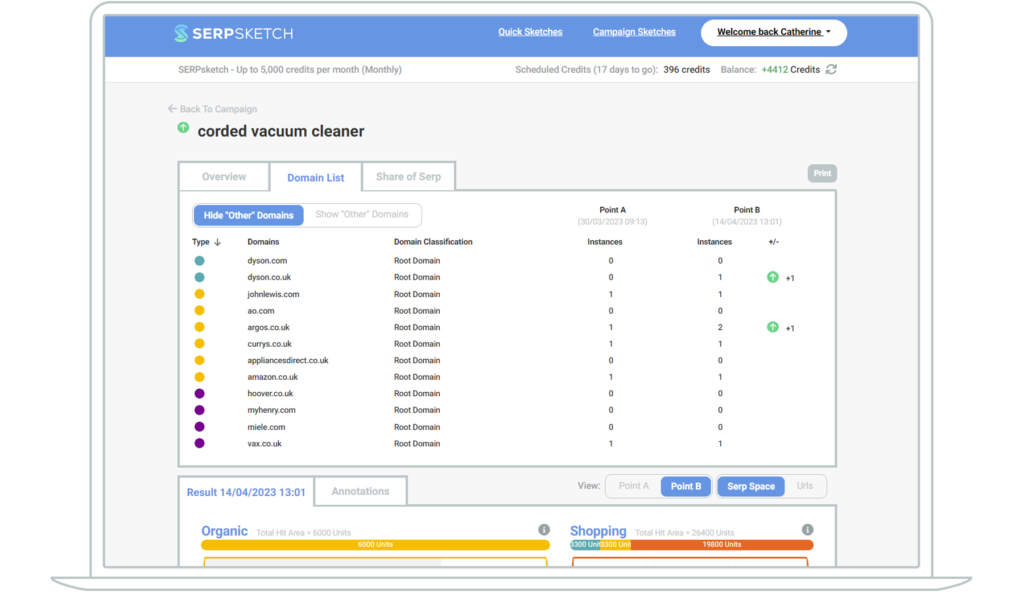
Domain List
The next tab shows you the domain list that you used when you added the sketch. It defaults to showing you the owned, competitor and partner (reseller) domains.
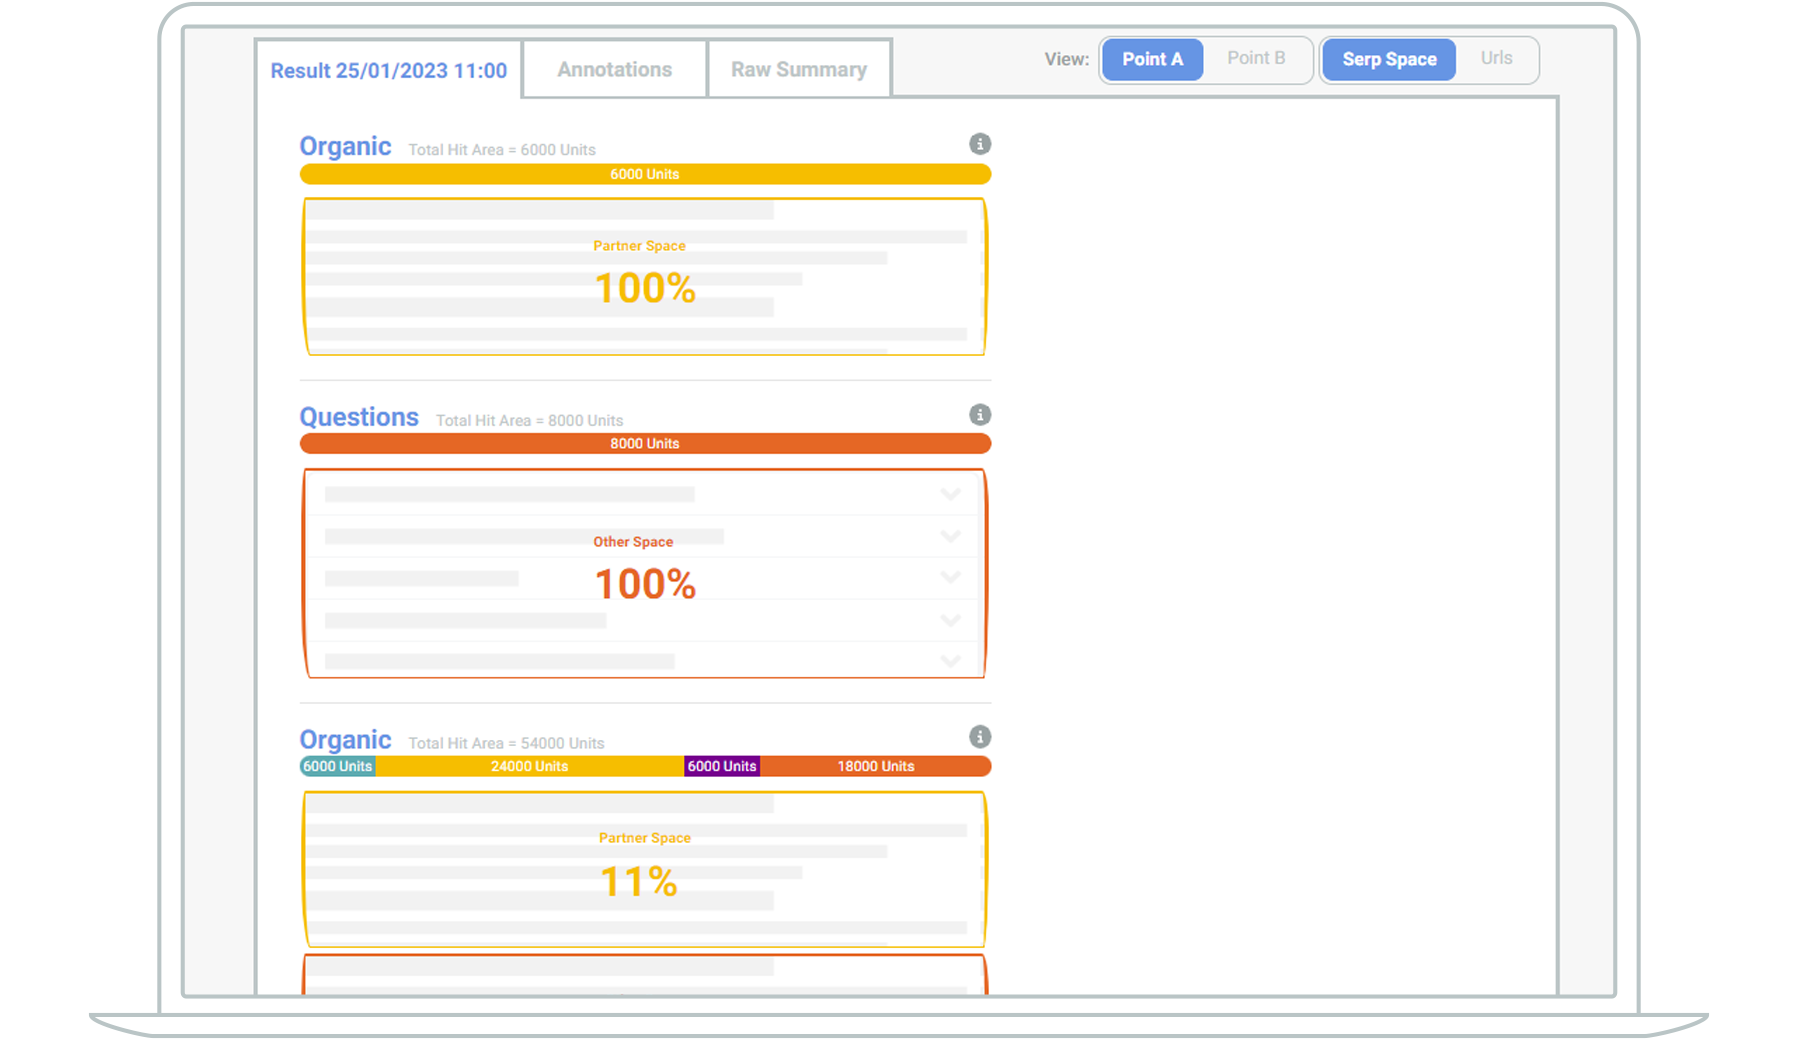
The first time you run the sketch, the domain list view will show you Point A and Point B as the same dates. Once it’s run a second time, you’ll start to see changes highlighted with green and red circles. Green showing an increase in instances that the domain has appeared on page one, red showing a decrease.
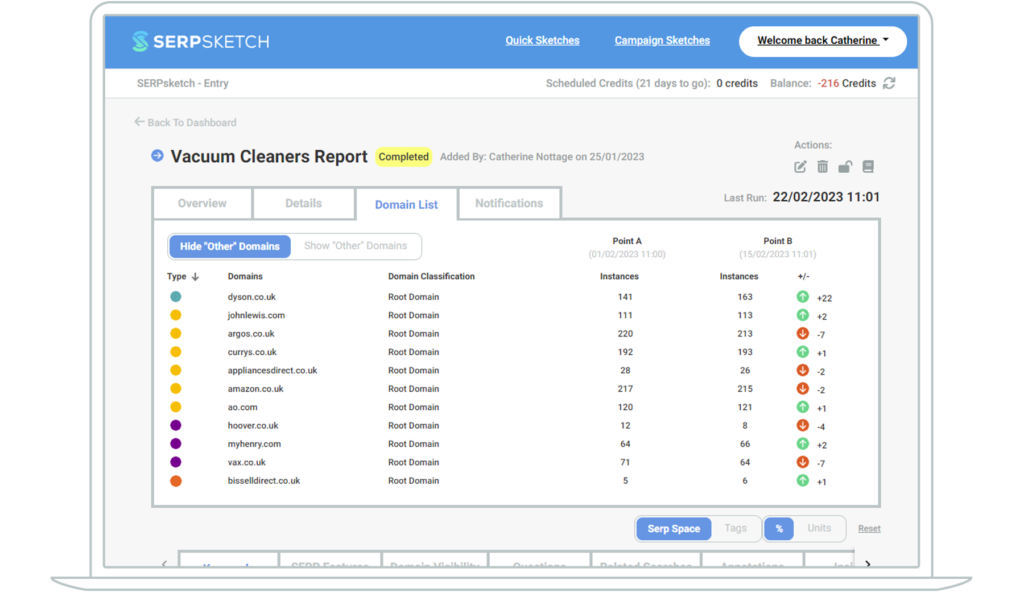
You can see the change from Point A to Point B – also indicating whether the new result is an increase or decrease from the previous point in time. (Note though that the first time you run your sketch there won’t be comparative data. That will only appear after you’ve run your sketch twice.)
You can also toggle on Other domains to check which others appear in Search for your keywords. This helps you to see if there are new, emerging domains that you didn’t know about coming up as competitors. And it’s worth highlighting that though you will have market competitors, some domains might be considered major competitors in your search space.
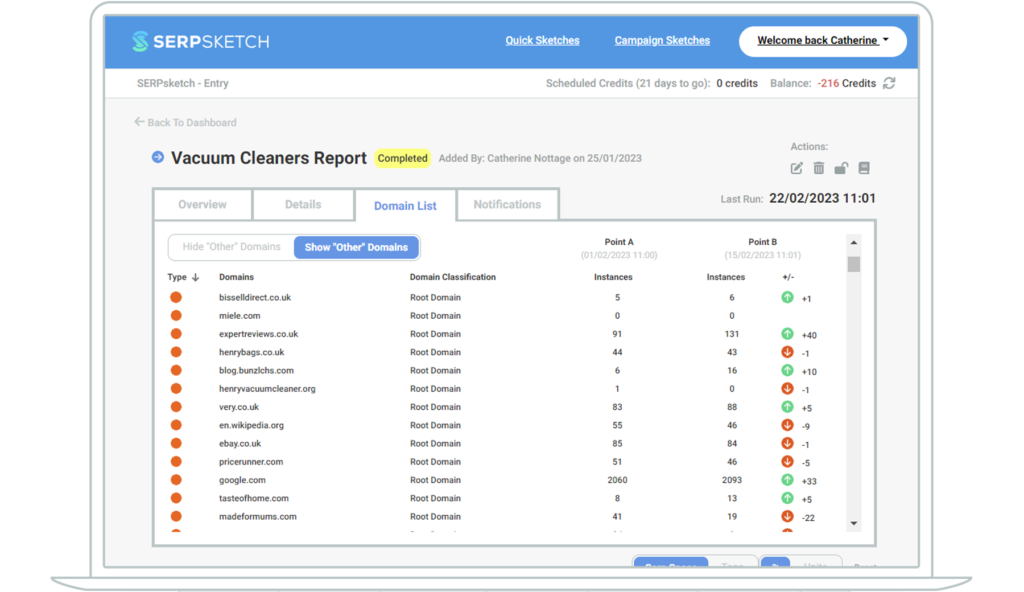
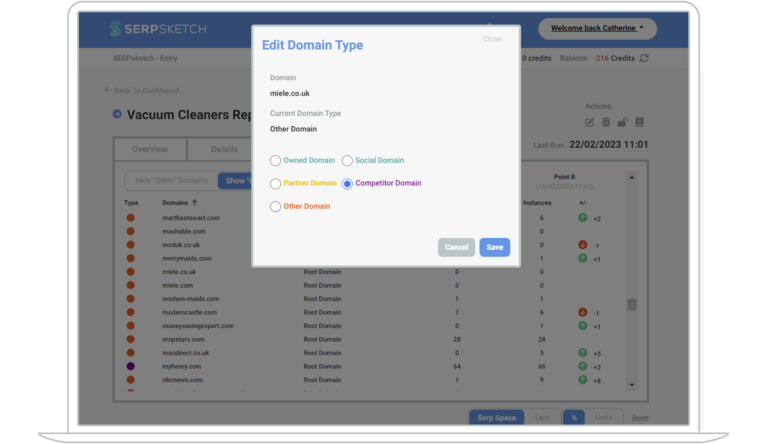
If you spot an “Other” domain that should be a partner or competitor, or even one of your own domains, you can amend it easily by clicking the orange circle to the left of the domain.
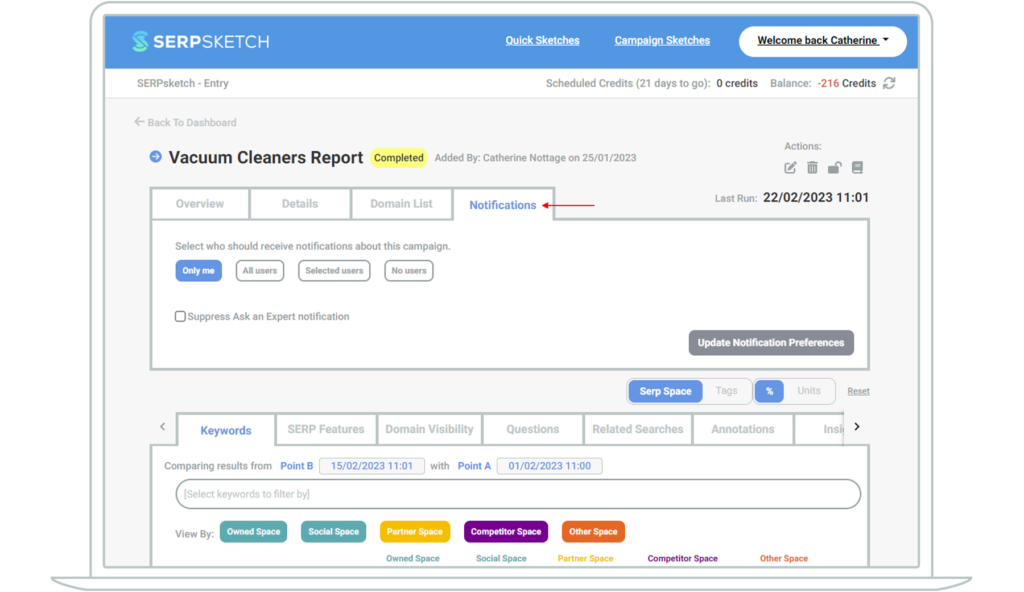
Notifications
So far we’ve only scratched the surface of the data and insights that SERPsketch provides you. Let’s dig into more of the features and find out how it really comes into its own.
You’ll no doubt have noticed that there are additional tabs midway down the page. This is the rich detail that SERPsketch provides about Google page one for your keyword sets, and for individual keywords too.
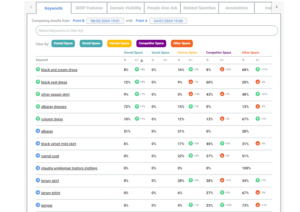
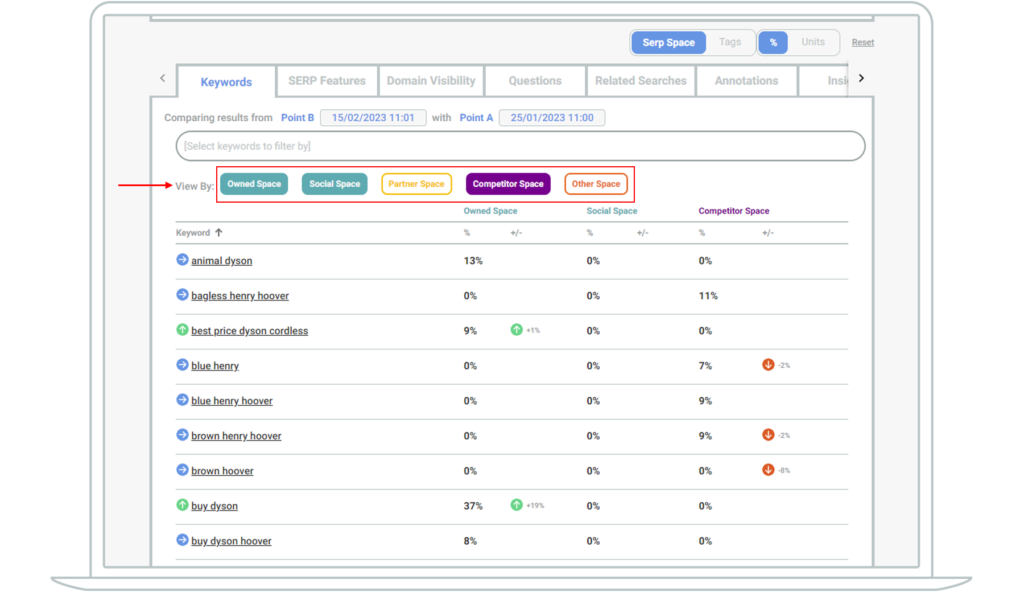
Keywords
On the keywords tab you can see all of the keywords you imported for your sketch.
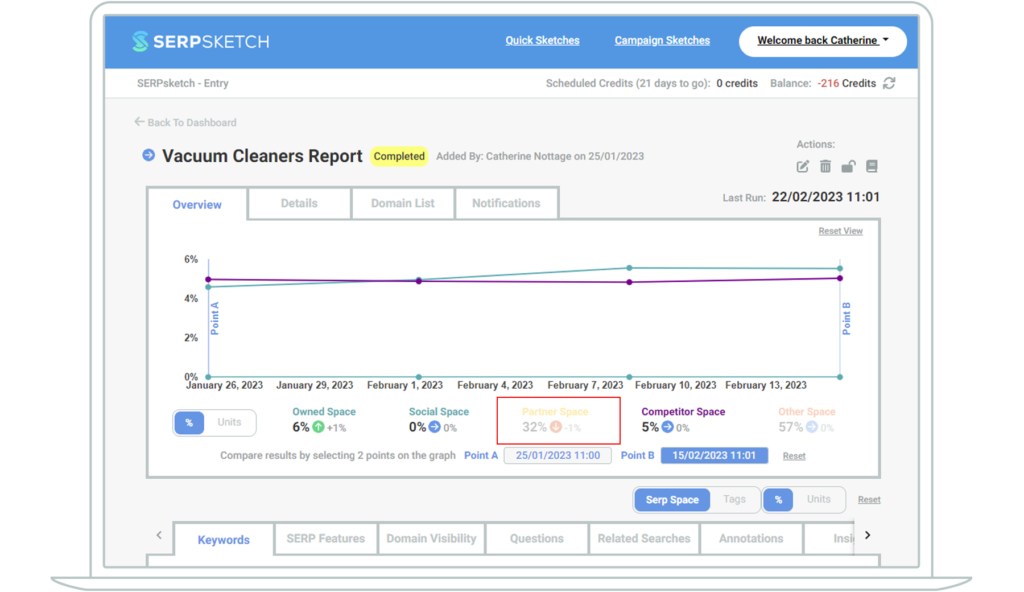
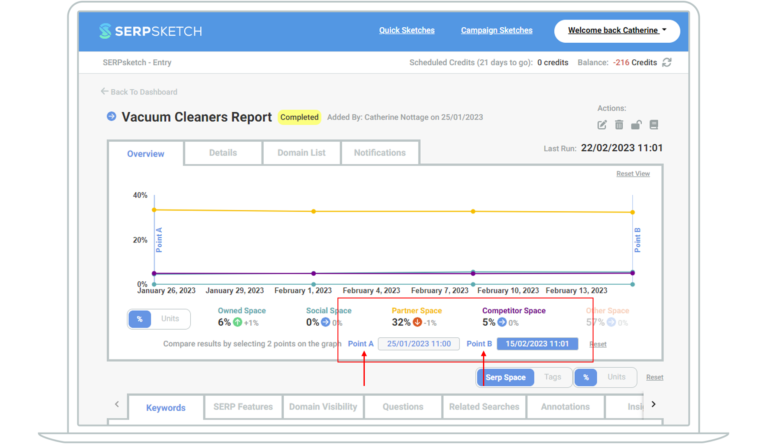
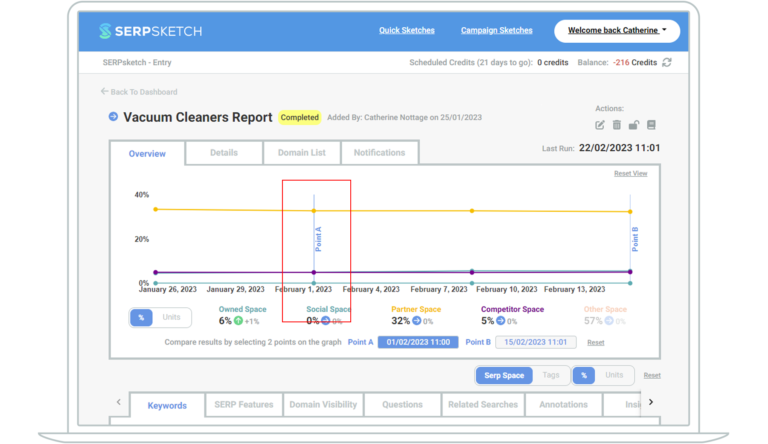
At the first run of your campaign, you’ll see the share of page one SERP space owned by you, partners, competitors or others – as a percentage. (You can toggle to show Units instead of percentage if you prefer. We measure space in units. Our SERPsketch units are similar to pixels.)
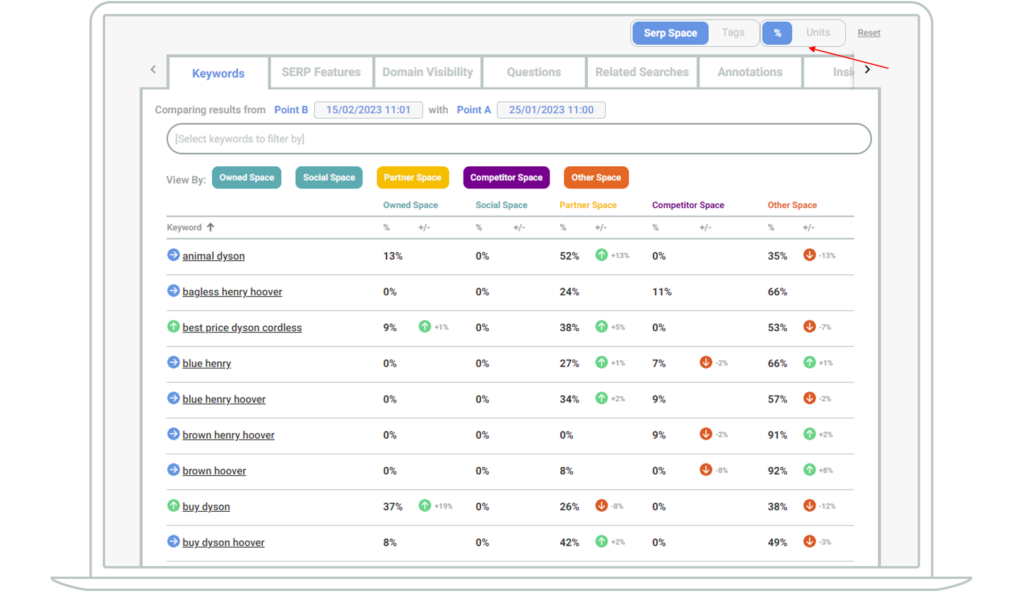
Once you’ve run your campaign sketch at least twice, you’ll start to see the change in space owned in the different domain groups between Point B and Point A (not forgetting that you can amend the points in the Overview section should you wish to).
The red and green circles with up and down arrows indicate whether share of page for that domain and that particular keyword has changed between the two points in time.
You can choose to filter your view by specific keywords. As a default ALL views will be visible, but you can also click on the “View by” buttons to remove that view from your report. E.g.
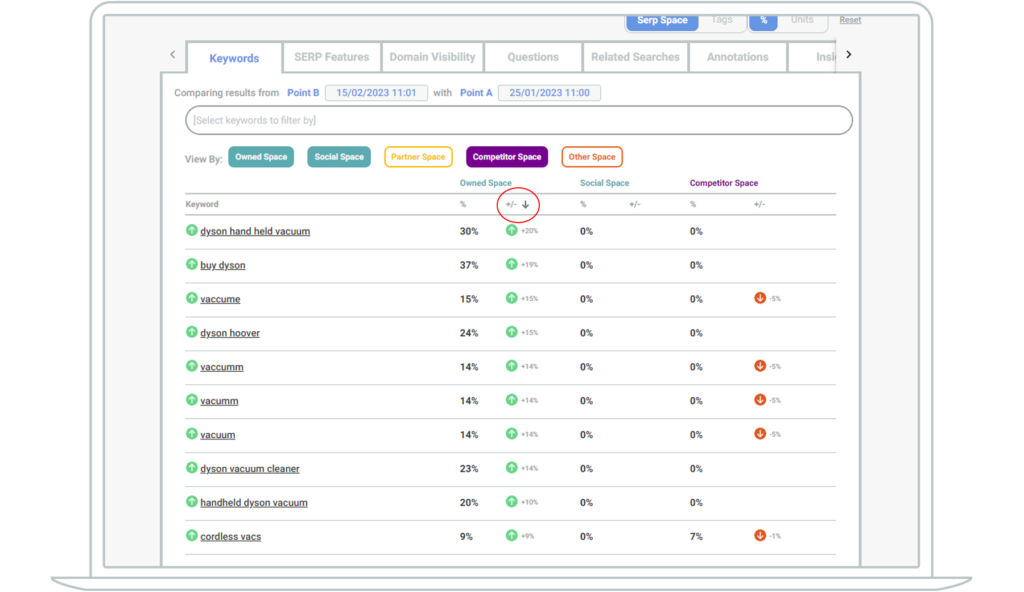
Viewing individual keywords
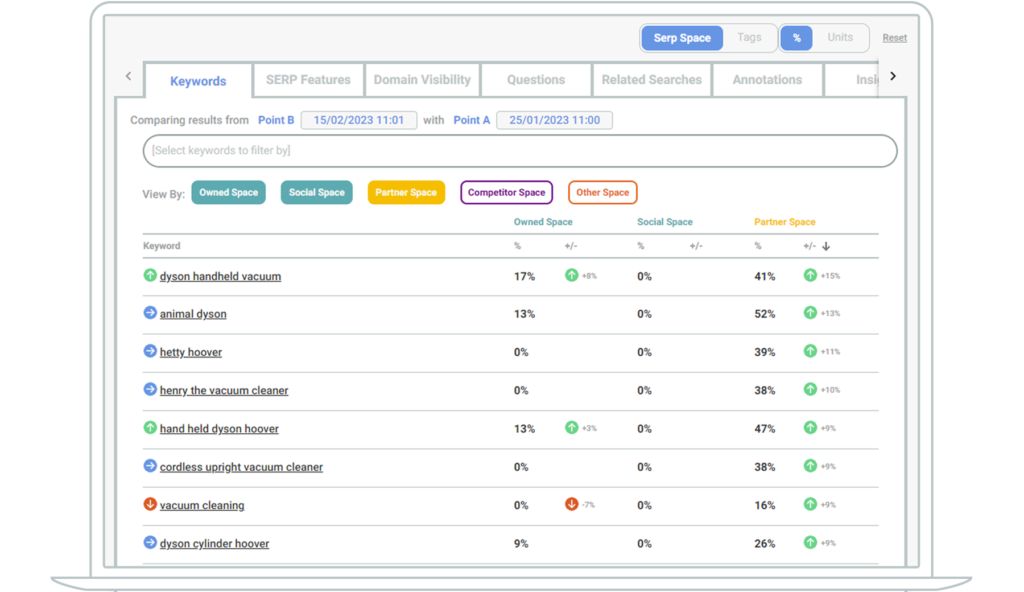
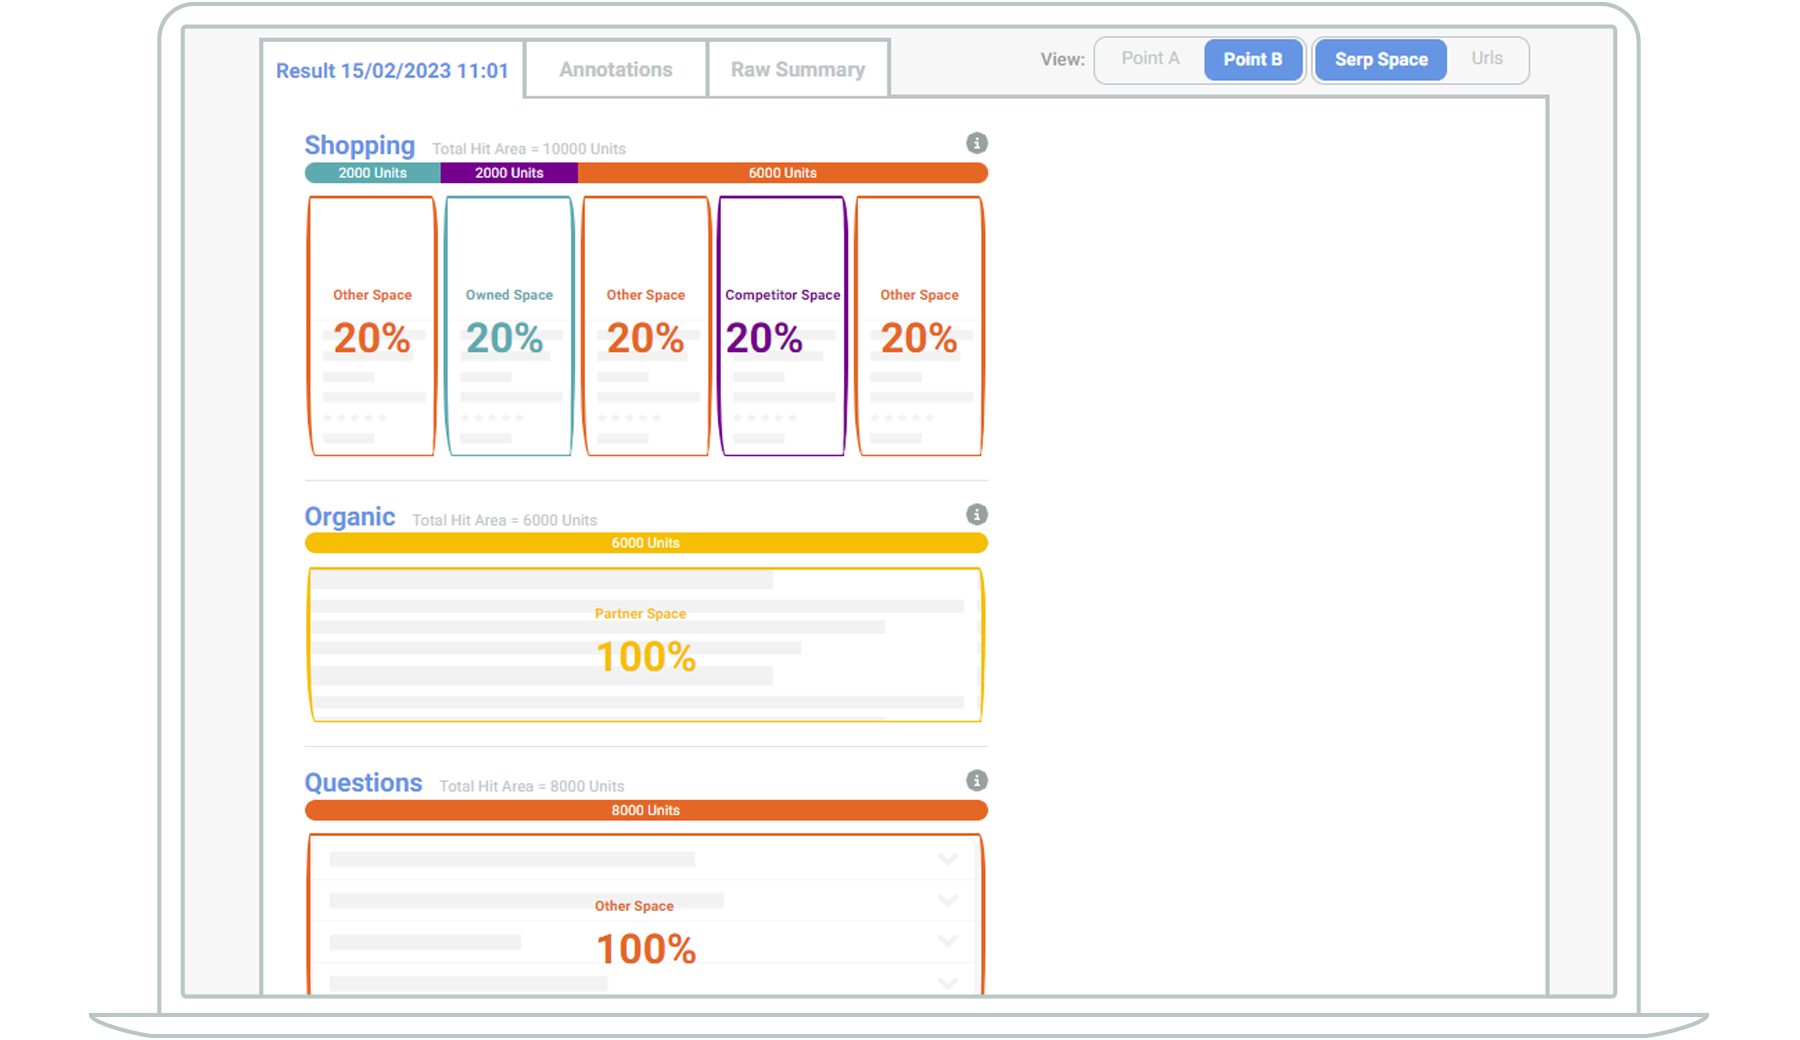
In this example we can see that the owned brand had zero share of page one at the start of this campaign. Over time its share of page has fluctuated but it’s gained 3% share of space from Point A to Point B. By comparing point A to point B in this visualisation we can see it’s come from the the shopping feature.
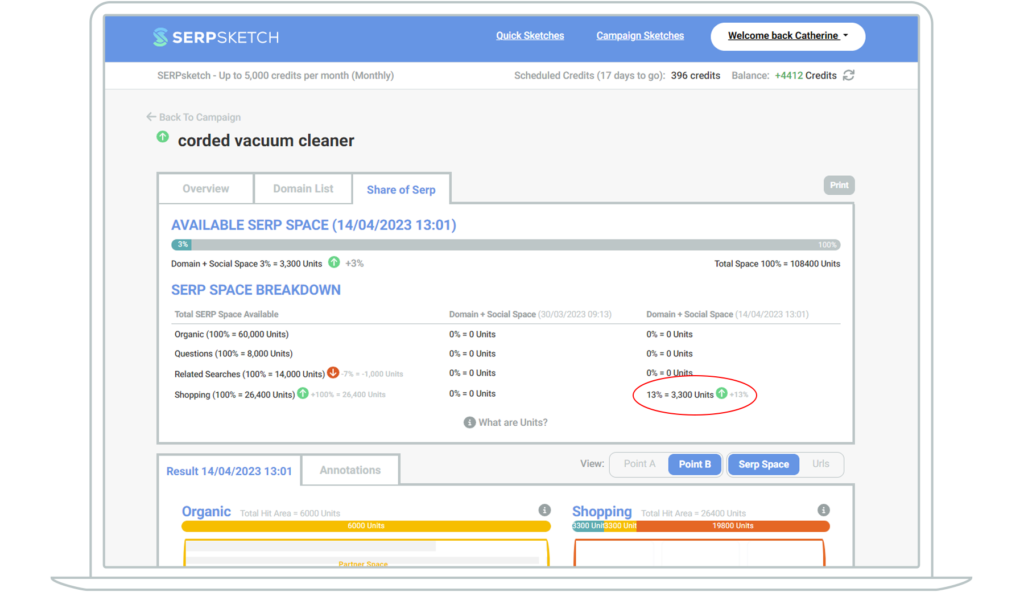
You can also see this gain in space on the Share of SERP tab. This tab breaks down the SERP space for that keyword showing how many units of space are taken up by different SERP features and the change in those features between point A and B. It also shows how much percentage share you have of the overall SERP space for that keyword, plus any changes in your share of that space.
Looking at the “Domain + Social Space” columns in our example below, you can see it goes from zero to 13% of the shopping feature units between Point A and Point B.
Visualising the SERP for a keyword
Beneath the overview of the keyword is a visualisation of the SERP space for that keyword.
SERPsketch shows:
- the Google SERP features showing for that keyword so that you can learn whether you need to focus on building out answers to questions, or increase PPC spend or focus video content
- the percentage share of space owned by the different domain groupings (owned, partner, competitor, other) for each feature

You can toggle between point A and point B to visually see the changes over time. In the below instance we can see the keyword had no shopping feature before, but now shopping dominates the top of the SERP.
But there’s even more to see.
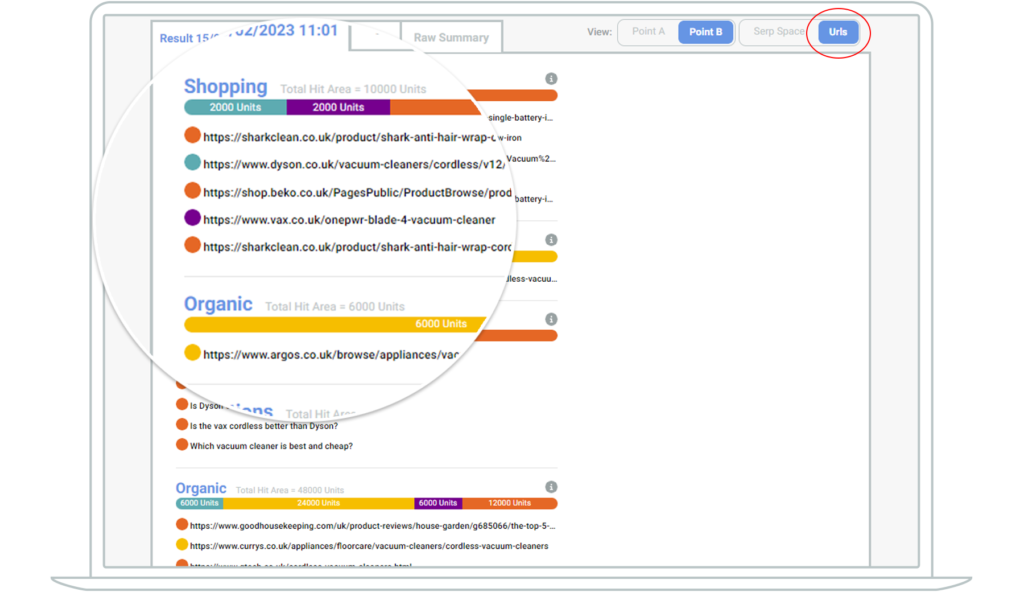
In the same tab, you can see the actual URLs occupying that feature. Either by hovering over the coloured space, or by toggling to view URLs instead of SERP space.
By viewing the actual URLs you can understand more about the types of content and pages that are winning in Google features and seek to replace that content with your own or use the information to learn which of your own content is already shared by Google on page one.
SERP features for your keyword set
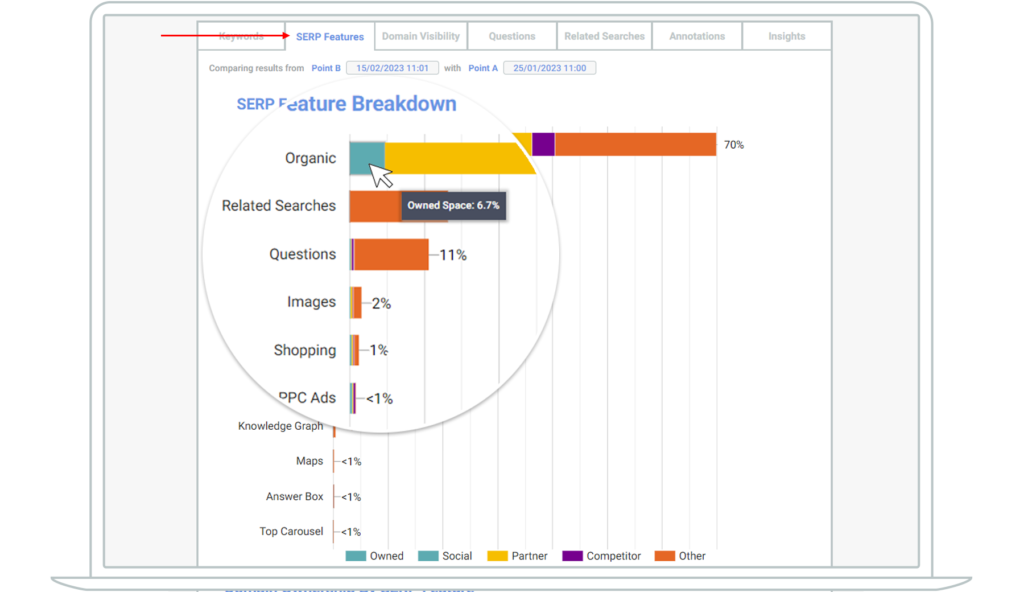
Returning to the main campaign results (i.e. exiting the individual keyword view), the next tab we can see is SERP features that dominate across your keyword set.
The first graph in this section shows you which features are occupying space on the SERPs for your campaign’s keyword set. So in this example, 70% of page one results are organic features across the whole keyword set, 13% are related searches and so on. But you can also see your own share of the SERP features across the keyword set. Hover over each coloured section and it will tell you the exact %.
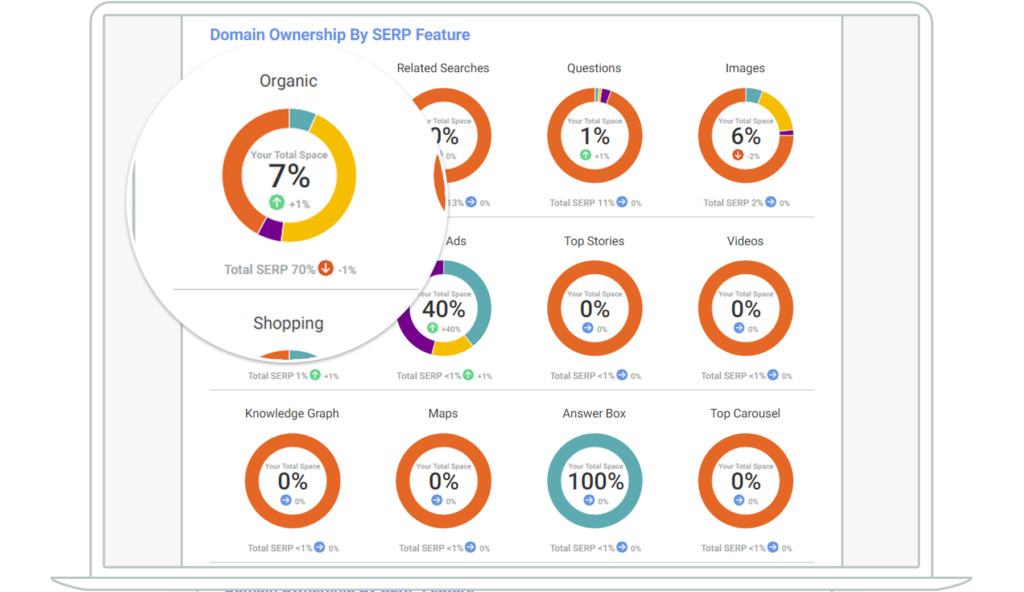
Scrolling down, the next set of charts helps to drill down further into the detail.
So like the above graph, here we can see that for this keyword set, 70% of the results are Organic (shown under the Organic doughnut), and we can also see that, of the organic results, your owned space is (rounded to) 7% of that. You can then see the detail for all the other features too.
Some features show very rarely in page one SERPs (less than 1% of the space), but the data is still capturing their share of page one in your keyword set.
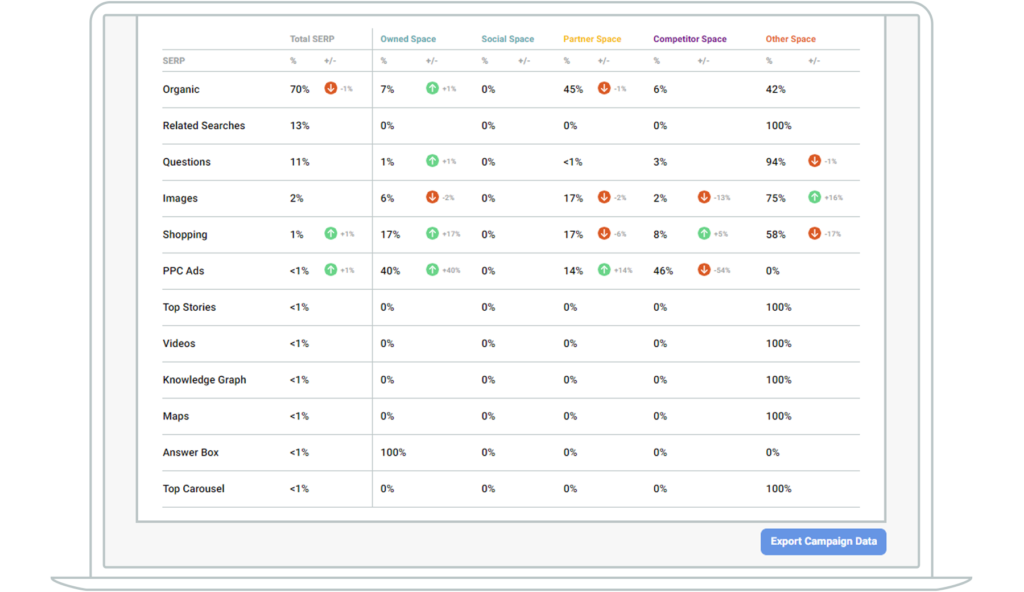
If you want to see more detail about the breakdown of those features, you can choose to “Export Campaign Data” (the button can be found on the bottom right of the page).
What’s so useful about the Export is that you can learn both the domains and the specific URLs that appear across a keyword set which can help you to find your most valuable pages or learn those of your competitors.
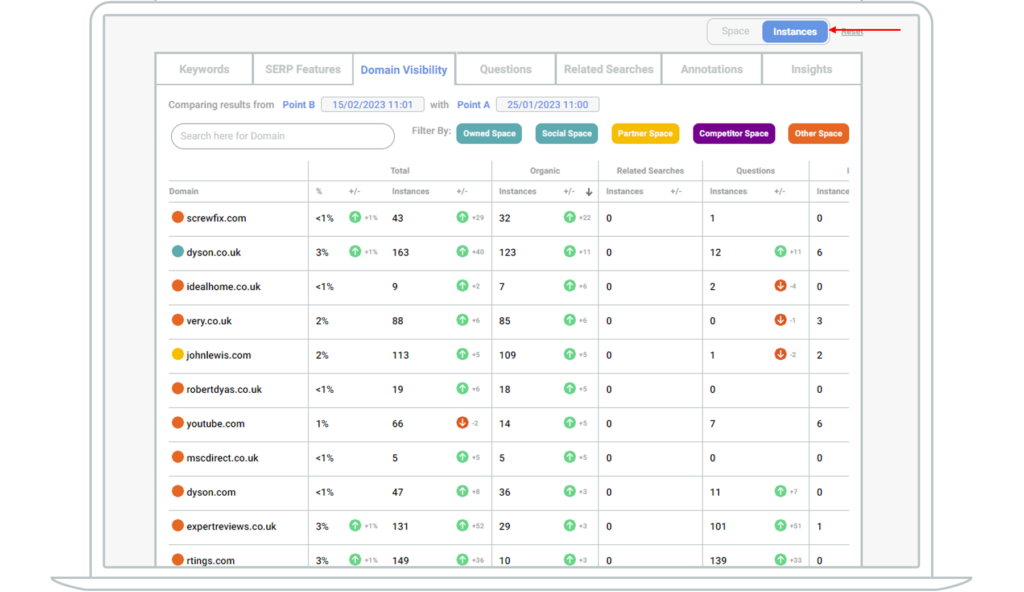
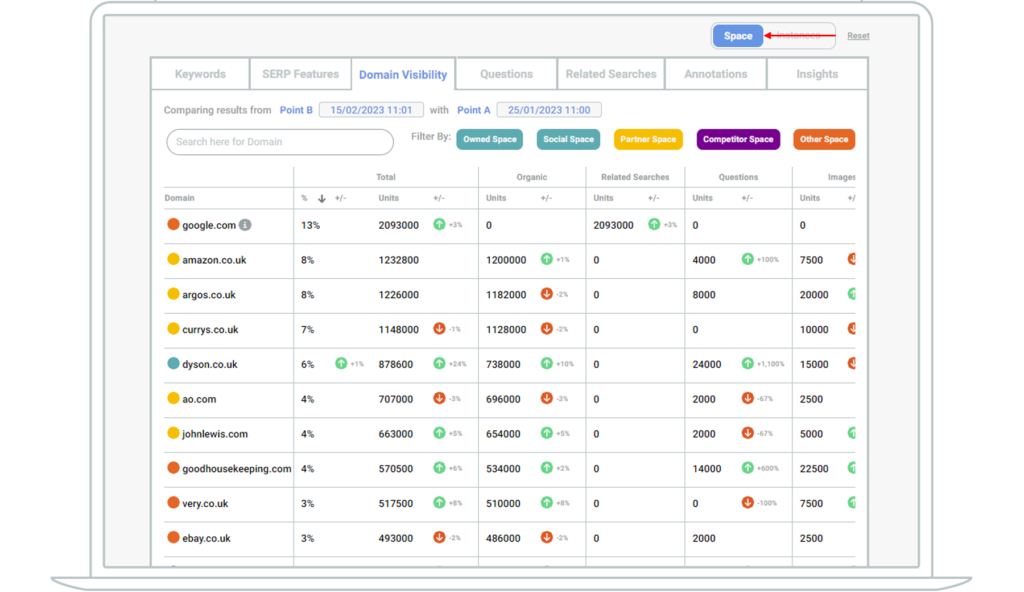
Domain visibility
Instances
This shows the frequency that a domain has appeared in the page one SERPs. In this example below, the list is sorted by the change in organic instances for the domains.
You can filter by the different domain categories. The default is to view all of them, but you can remove some from the view simply by clicking the domain button.
Space
Toggling to view domains by space, you can see the amount of SERPsketch units owned by each domain across the keyword set, and the change from point A to point B. Remember that to dig into the specifics of the data you can export it and understand the specific URLs featured for that domain.
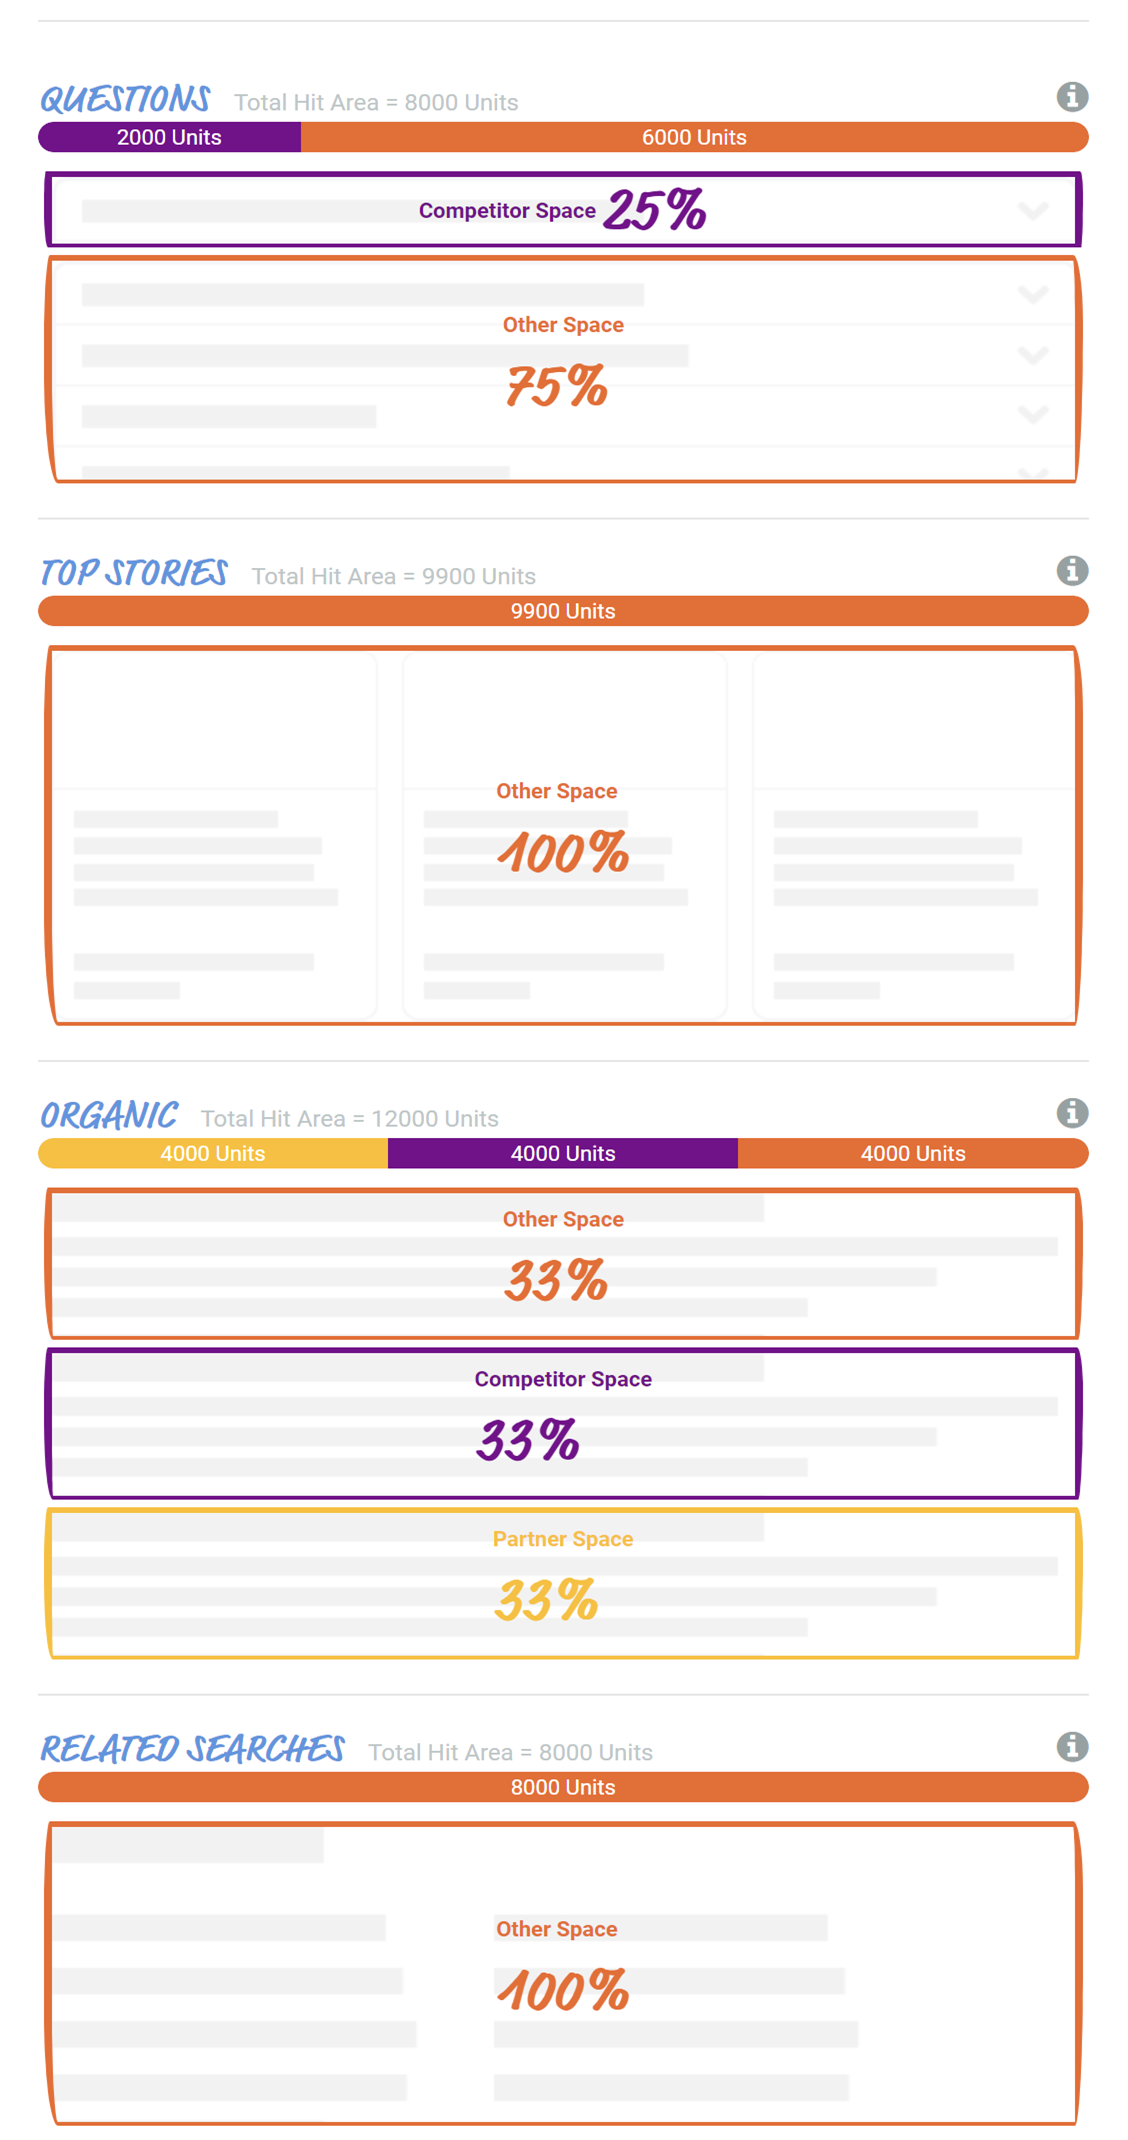
Questions
The “People also asked” feature in Google is useful for understanding more about the content your audience might be seeking.
What’s different about the way SERPsketch provides you this information is that you don’t just get to know a few of the questions per keyword. You can see all of the questions that have appeared for your whole keyword set, and you see the number of instances those questions have appeared on page one too.
You can expand each question section and understand the specific keywords that triggered that question too.
With this level of detail, you can easily prioritise your own content to answer the most frequent questions.
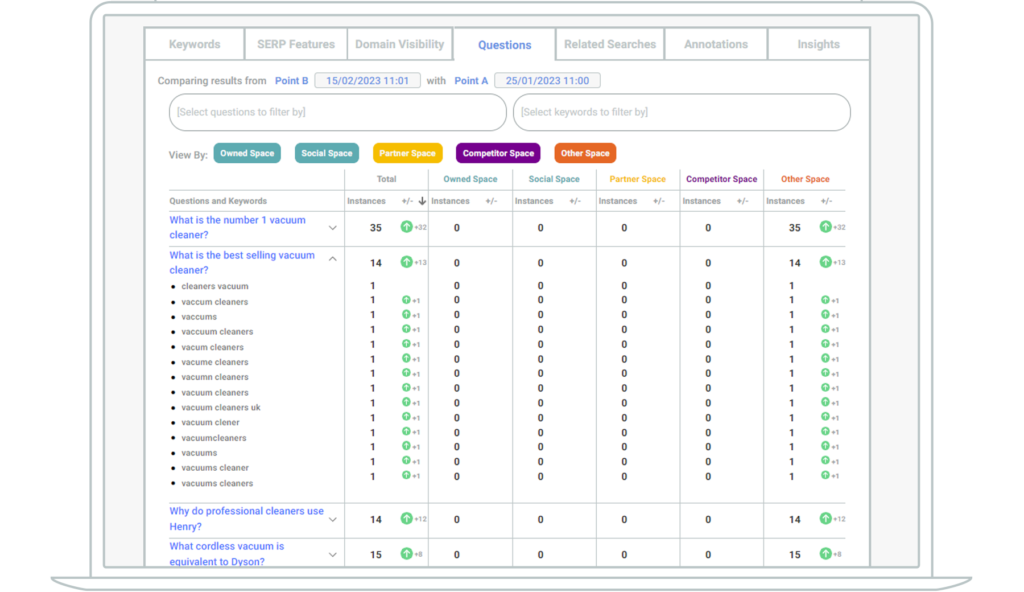
Other clever ways we’ve seen this feature used is to help build out product or service page content. Add product names or part numbers as a keyword set and see what Questions Google shows for those. This gives you great content ideas for what your prospective customers might want to understand before purchasing.
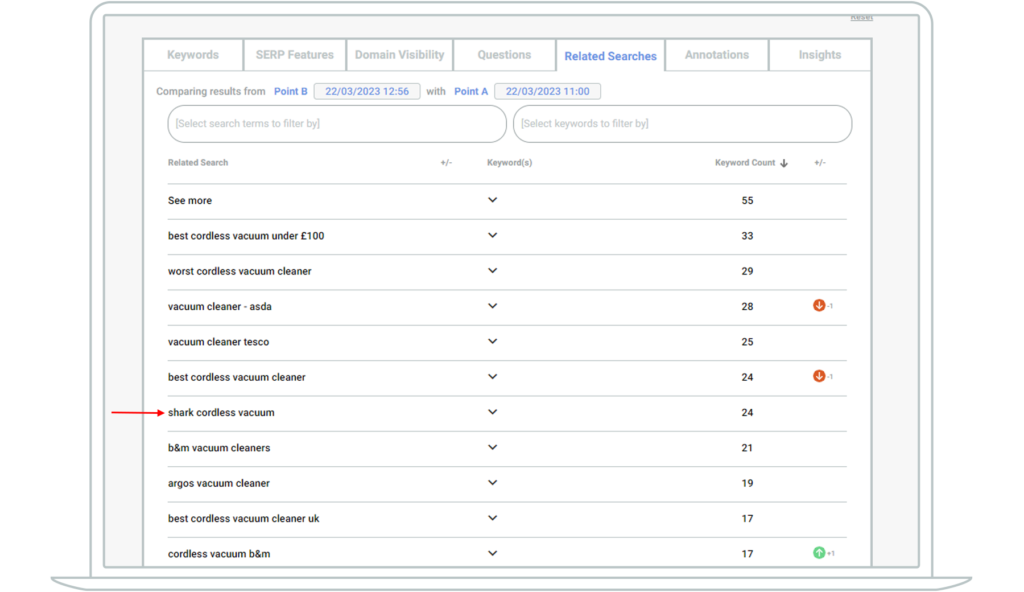
Related Searches
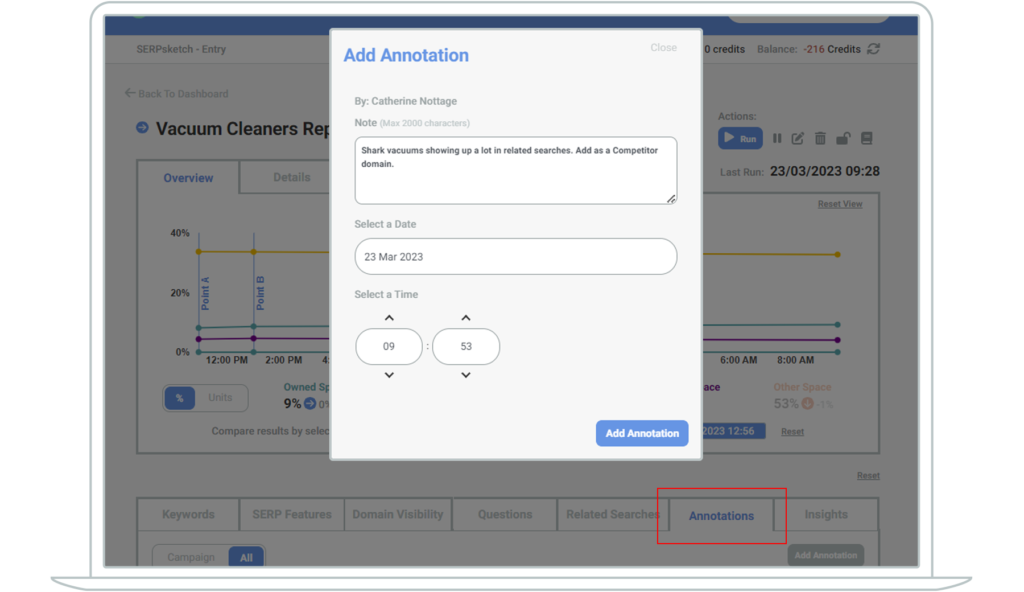
Annotations
You can add annotations to your campaign for reference. For example, you might make a change to your search strategy as a result of the insights gleaned from SERPsketch data and so may want to take note of any changes you’ve made.
SERPsketch will auto-add an annotation noting when the sketch was first created.
Insights
SERPsketch Insights is a relatively new feature and there will be new insight types added over the coming months.
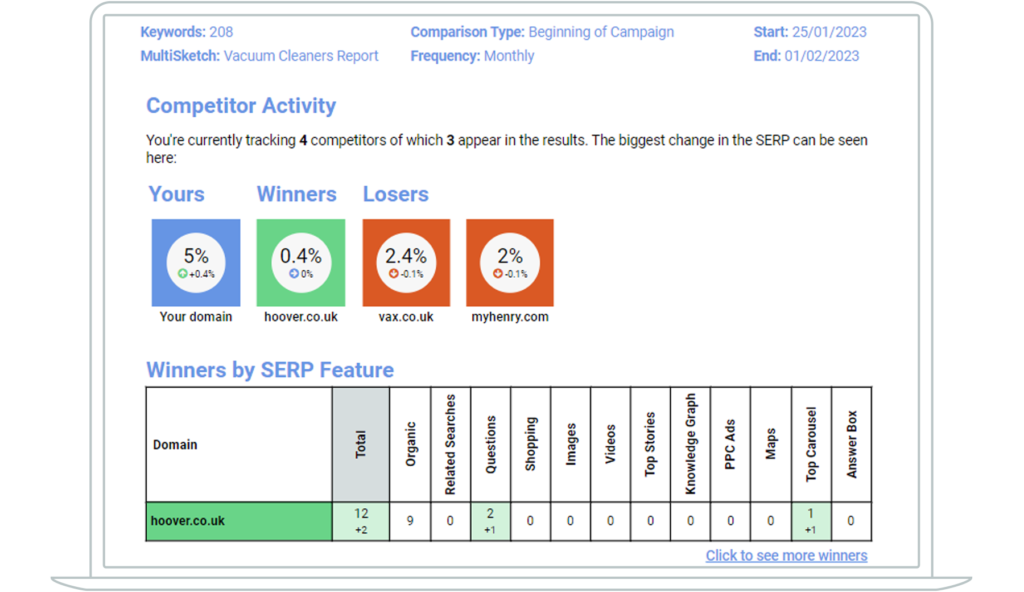
Our first Insight is Competition-related. When you set up your sketch you can set the frequency that insights are created.
The Competition Insight report will summarise specific winners and losers between you and your competitors. You can also have the report emailed to people in internal or external teams who aren’t specifically users in SERPsketch but you want them to be informed of the insights on a regular basis.
That just about covers everything that you see when using SERPsketch. What’s important is how this additional analysis sharpens the insights you’re getting from existing tools, enabling you to focus on gaining page one space for your most important keywords.
To try SERPsketch free for a month, sign up here.