SEO is often a difficult area of marketing to explain to leaders. It’s a slow process, you’re unlikely to see results overnight, but rather over months. It can be difficult to show the progress you’re making and often leaders just want to know whether you’ve finally secured that top spot in organic ranking.
It’s hard to get buy-in from leaders to invest in SEO from the start because it can be such a slow burn. But failing to do it at all, or doing it badly, may set you back years from where you should be. The difficulty is that it’s impossible to determine what organic traffic brands are missing because they didn’t invest in SEO. But what one can do is understand what competitors are doing. If competitors are investing in SEO, then it’s a sure sign you should be too.
In this article, Tessa Nadik, Sr Director of Product Management, SEO and Content Strategy at Kelly Blue book & Autotrader explains that there are often questions from stakeholders about SEO. If done well, an investment of time and budget is required and when you’re living and breathing SEO, it can be hard to take a step back and think of how best to position it to those with less knowledge.
Explaining SEO results visually
Yes, rank tracking is still interesting for SEO but more importantly these days it’s about how much you dominate page one SERPs for your keywords, especially for your most important keywords.
Being able to visualise and quantify your share of page one, showing progress over time, your gains and losses or those of your competitors – that would be hugely valuable in demonstrating the power of the SEO programmes you’ve put in place. Add on to that a view of all of the people also asked questions and related searches that have appeared on page one for your keyword sets enables you to make strategic choices that keep you ahead of the competition.
SERPsketch was created first and foremost as a page one visualisation tool which has evolved into something much richer.
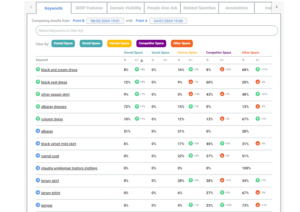
See which features of Google are shown, right down the keyword level
Those outside of SEO often focus on ranking on page one, position one in organic results. That’s what they think SEO is.
That might have been the case years ago, but Google has been adding rich features to its SERPs for a long time now and those rich features help users get the answers they need without needing to leave page one.
A tool like SERPsketch helps to show leaders what actually appears on a SERP for their keywords and helps leaders to understand which features are prominent in the space. SEO managers can then use this visualisation to help justify investment in, for example, FAQs for the People Also Asked feature, or recommendations that the paid ads team spends more to secure Shopping or Ad space.
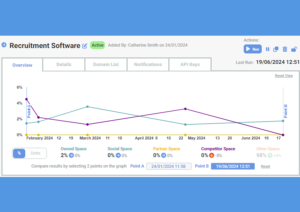
SERPsketch can show leaders the changes between two points in time too.
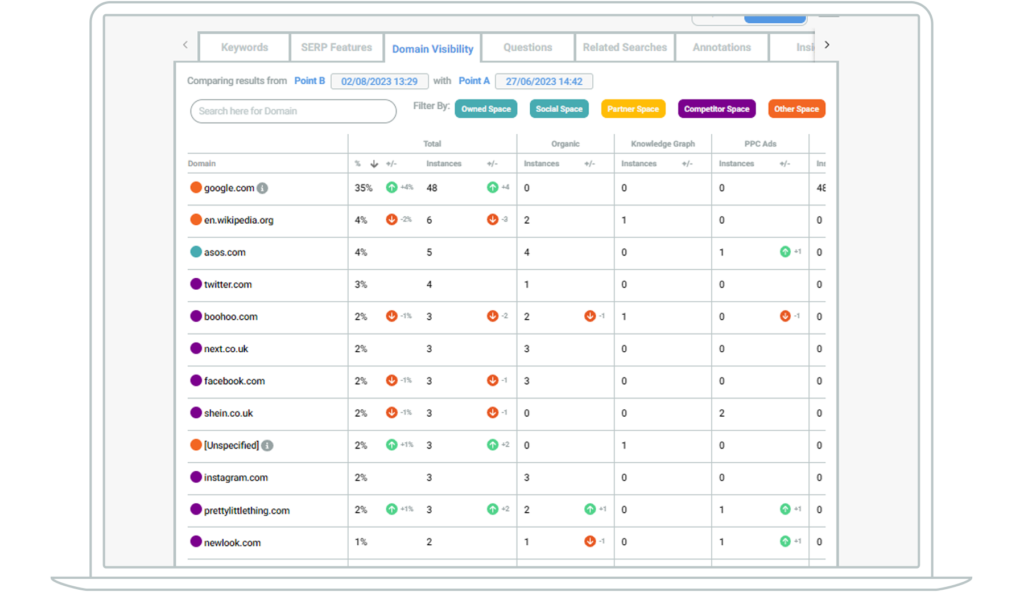
See who is competing against you for visibility across these features of Google
In search results, you’ll likely have some brand competitors appearing on the page one SERP, but you’ll also have some other types of companies competing to be on page one. If you’re selling software, you’ll probably find that you’ve got comparison sites or review sites appearing on page one. If you’re selling cosmetics, you might find lifestyle websites appearing with articles on best make up brands or such like.
With SERPsketch you can see who is competing against you for page one visibility. You can label the competing domains with a competitor, partner or other domain type so that you can get an idea of the share of page one by each type. You can decide how you want to categorise different domains. For example, let’s say you’re Le Creuset and you’re selling on your own website but also through John Lewis. It’s your decision whether you choose to label John Lewis a partner or a competitor. We recommend that if you don’t mind if share goes to another site who happens to be promoting and selling your brand or products, then mark those as partners (so long as the page they are promoting leads to your products of course).
See where there are opportunities to out-manoeuvre your search competitors
Search analysis isn’t just about understanding what your competitors are doing; it’s also about what they’re not doing.
In competitive landscapes, spotting a missed opportunity or a quickly emerging area is a great way to ensure that you’re making the most out of the time and money you do invest into search.
SERPsketch enables you to see new types of SERP features coming into your landscape, or if a competitor has changed tactics at all. This helps you to see where there may be gaps or windows of opportunity you can jump on.
For example; you may notice on your high priority terms that new questions are emerging in the People Also Ask section, which currently your competitors are yet to notice and provide answers for. If you can move quickly to produce expert content on the topic then you could step in to take this position, making it a much harder challenge for a competitor to take that space.
Making SEO as easy to understand as possible
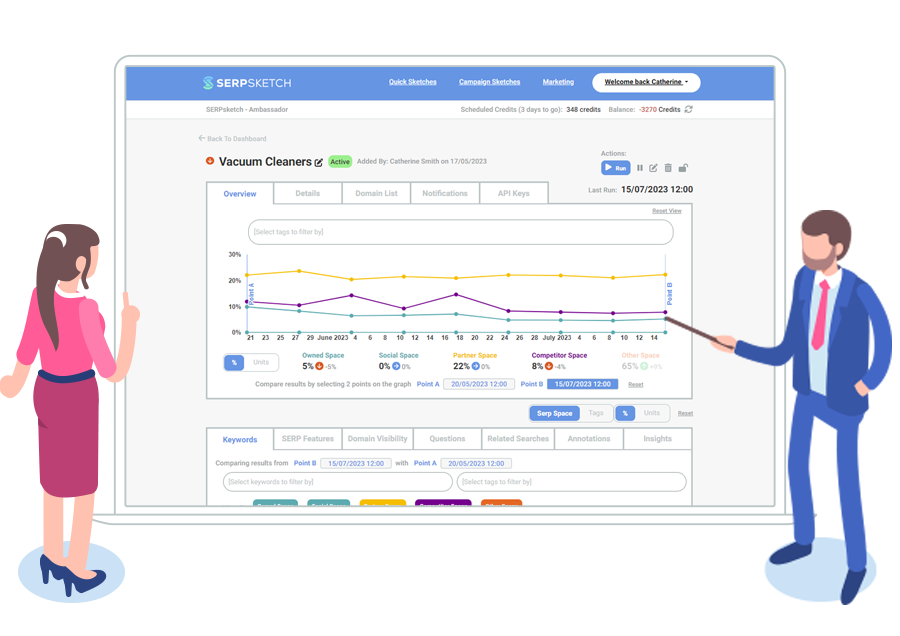
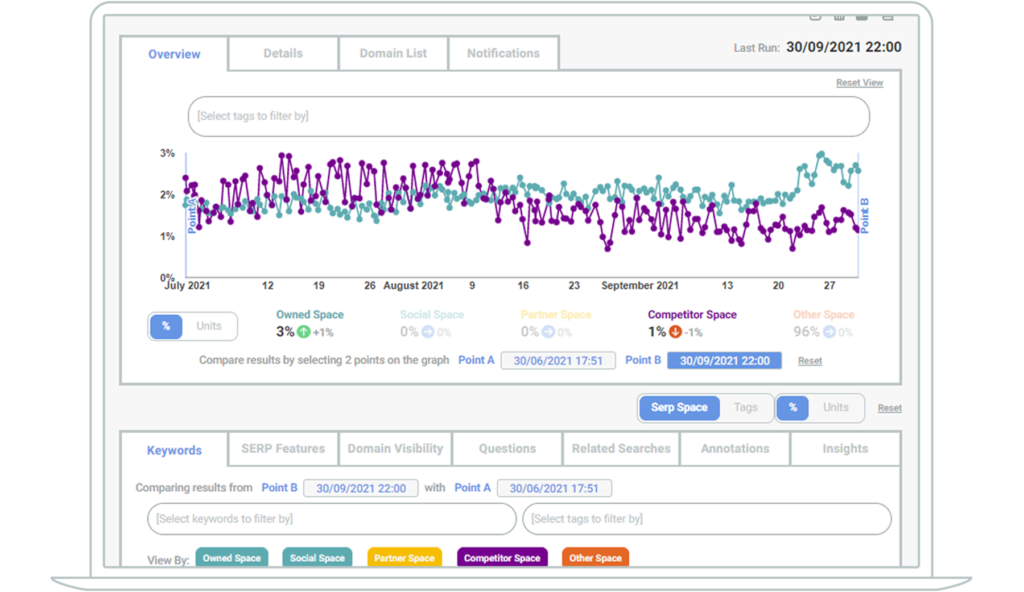
Though the decisions you make based on the data in SERPsketch require a good understanding of SEO, the graphs and charts that SERPsketch provides make it easy for stakeholders to understand. Within each campaign sketch you can see:
A line graph overview of share of page one for your keyword set over time
This will show highs and lows and changes in the share. Sometimes it’s very stable, but sometimes in competitive spaces the share can fluctuate a lot and often. You can see this both as an overview of all your keywords, as well as for each individual keyword too. It’s an excellent way to prove that your tactics have resulted in increased share of page.
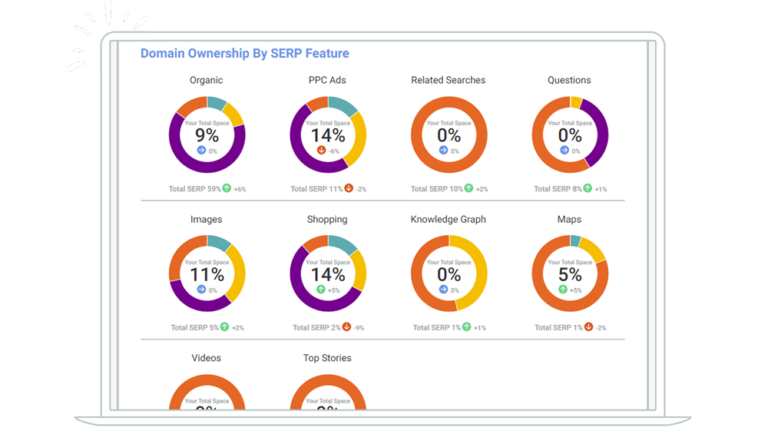
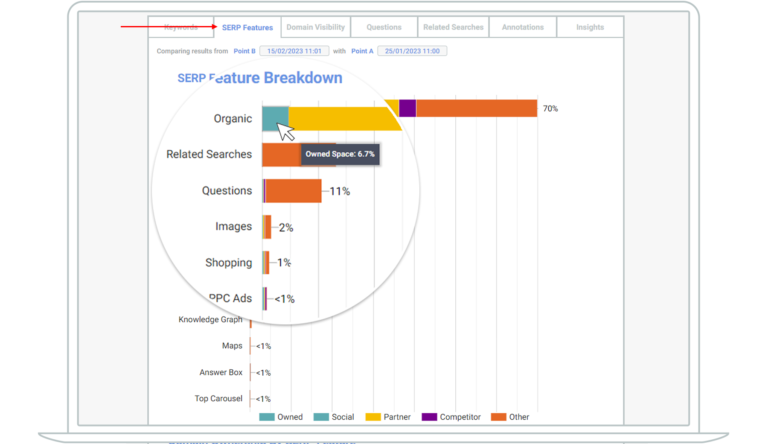
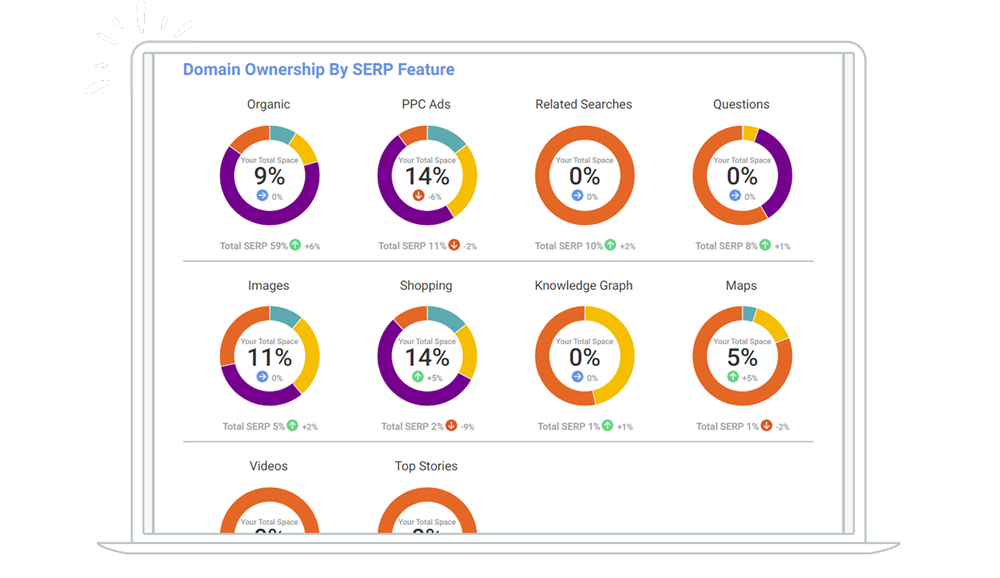
SERP feature breakdown
Shown in three different ways, the SERP feature breakdown firstly summarises all of the features Google is serving for your keyword set so you know, for example, if shopping or ppc ads appear at all, if maps appear sometimes, if organic features are high, medium or low.
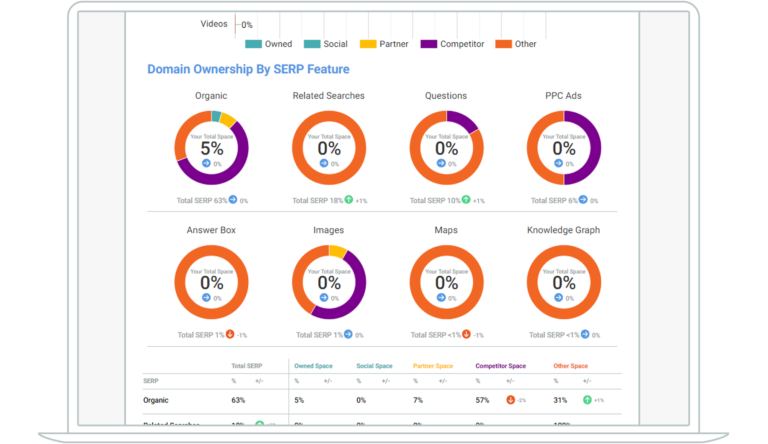
It shows you the share of each feature on all the page ones for each keyword in your keyword set, and the share of each domain type within each feature.
It shows you your total share of space for each feature and indicates whether that’s increased or decreased between your two specified date points.
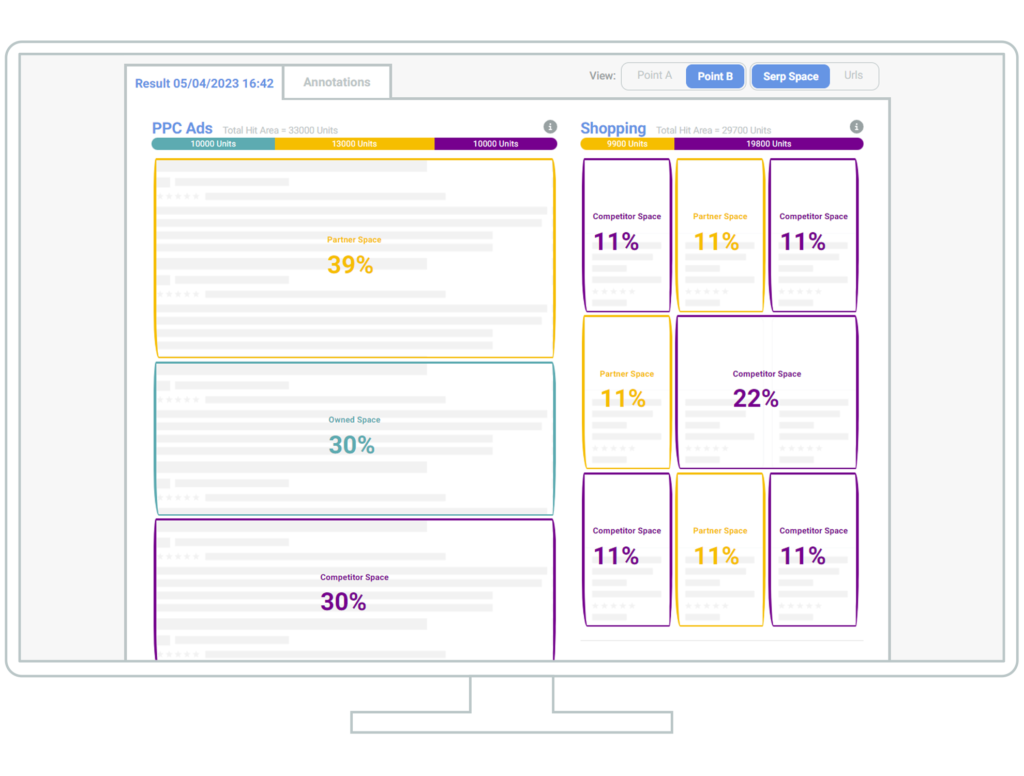
Visualisation of a page one for an individual keyword
Within each individual keyword that you’ve added to your sketch, you can view the recent and previous visualisation of page one, showing each space taken up by feature and domain type. And you can toggle between that view and seeing the actual URLs in use.
Useful for other marketers too
Not only is SERPsketch useful for leaders to understand the impact of SEO, but other teams within marketing benefit from its insights.
Content marketing can use Related Searches and Questions to understand the types of content that users are looking for and write about those topics to help organic reach.
PR teams can use it to analyse topics or for generating news ideas. For example, the LTA commissioned research into gender bias in tennis. Digital Consultancy Verkeer used SERPsketch to examine the results for specific keywords and the results demonstrated there was a heavy bias towards male tennis players in the results.
Product marketers have used SERPsketch to help understand what their customers want to know about their products. One brand added their part numbers into SERPsketch and looked at what Questions appeared as a result, helping them to understand what content would be best served on the product pages to address those frequent questions.
SERPsketch was created to make page one analysis much easier to understand and to simplify the way those results could be viewed, rather than having to cobble together data from multiple sources. It’s free to try for one month, so why not sign up and add your keywords?